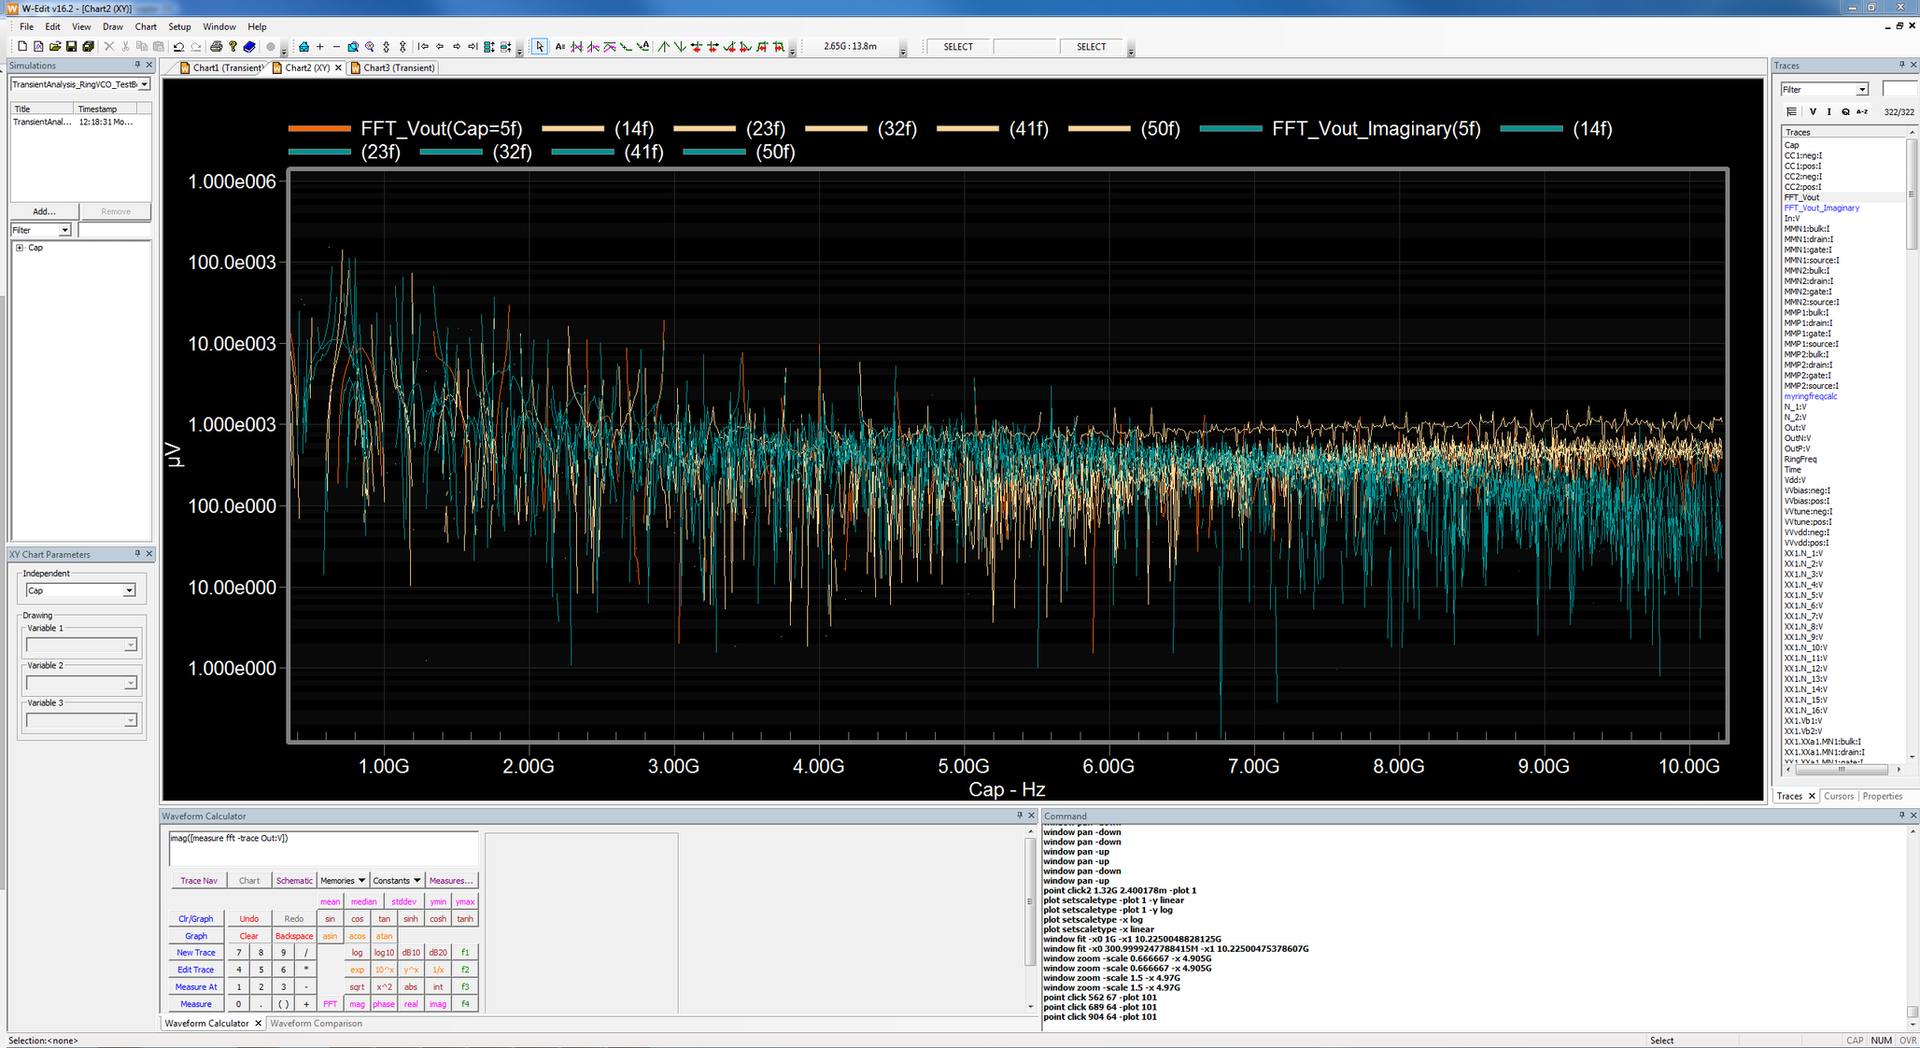
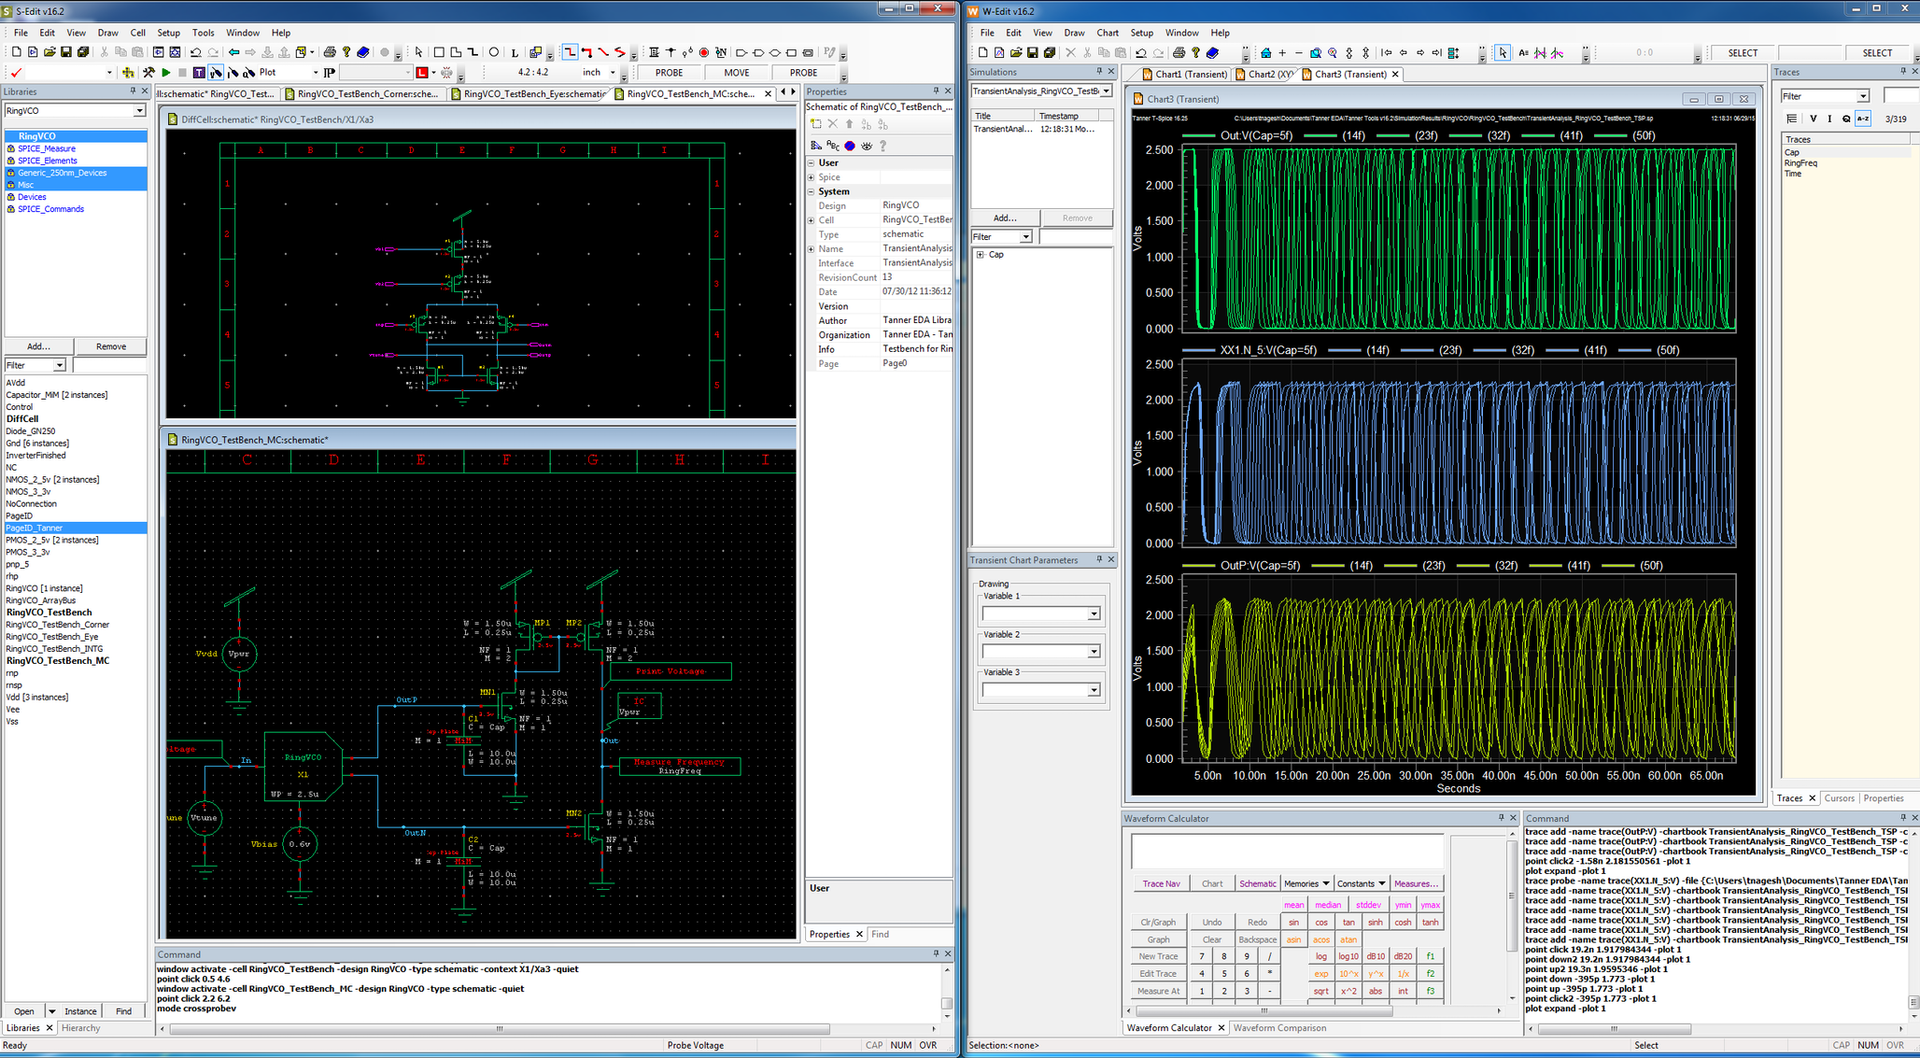
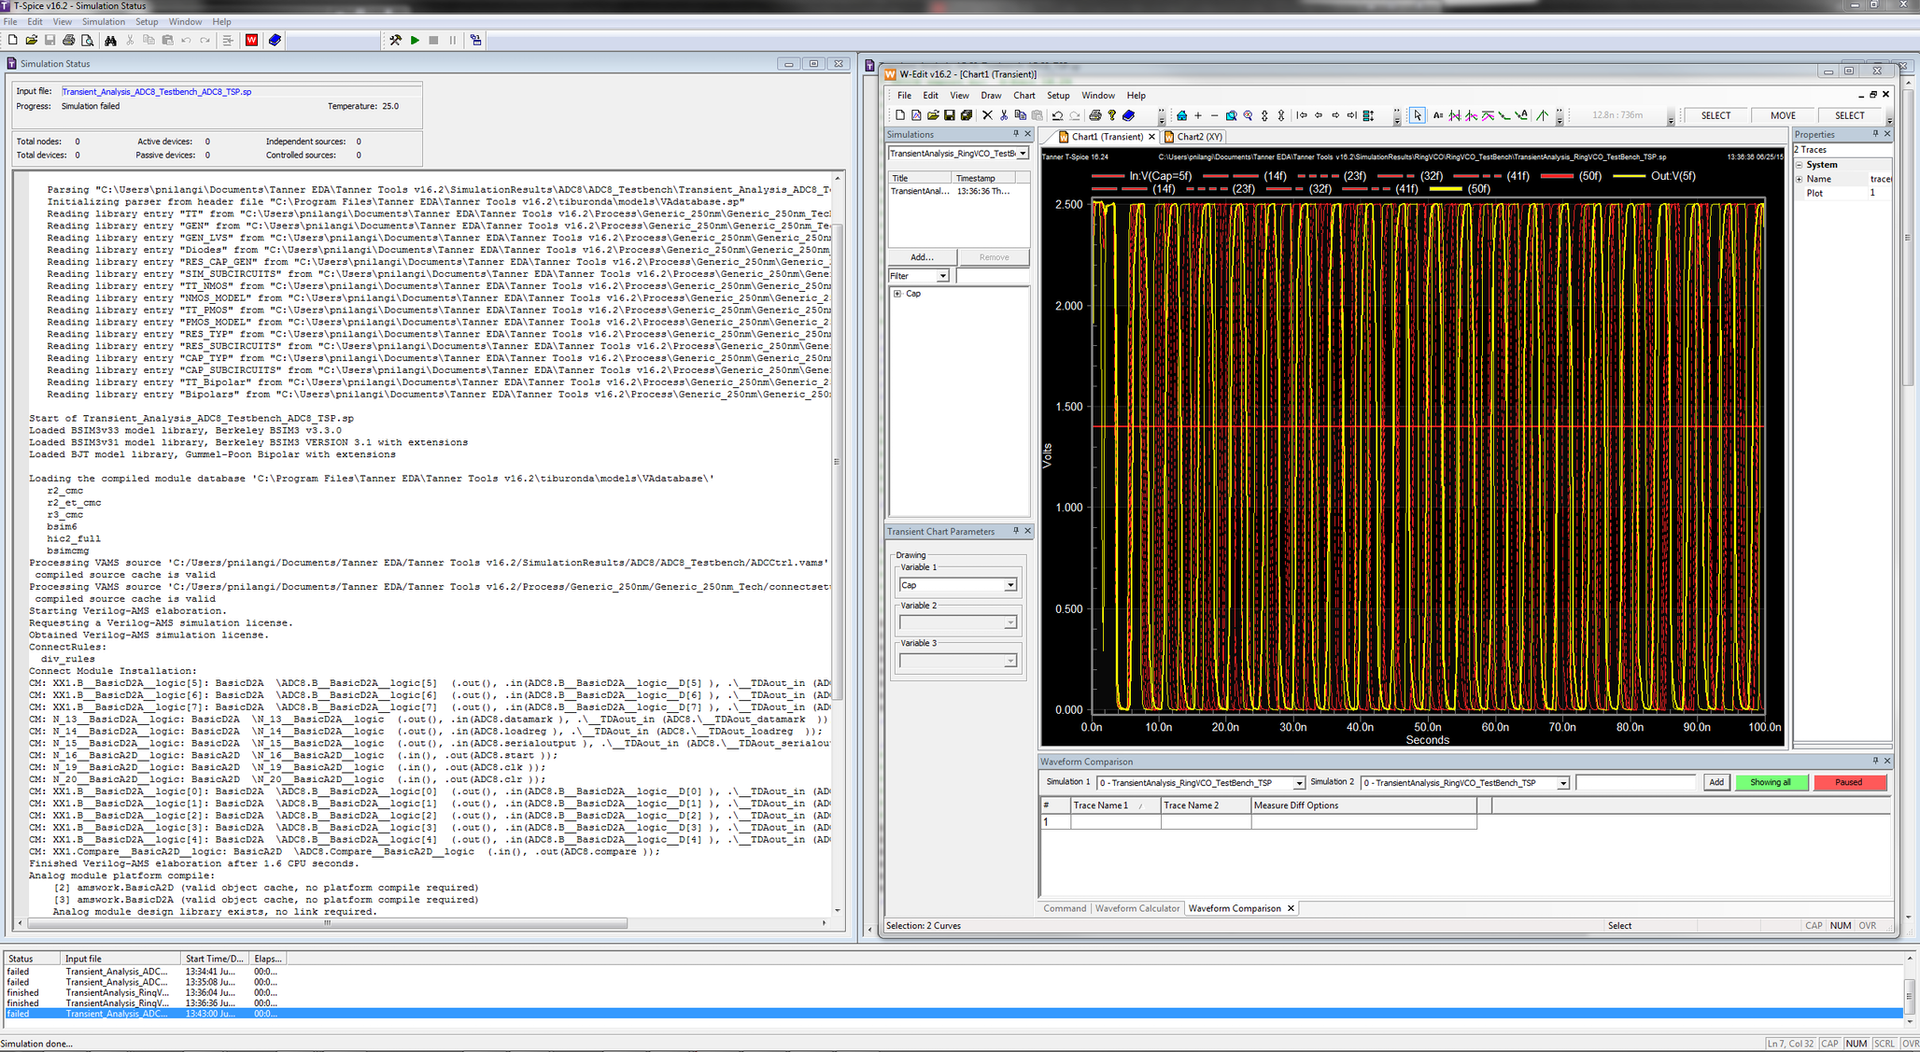
Tanner Waveform Viewer (formerly known as W:Edit) provides an intuitive multiple-window, multiple-chart interface for easy viewing of waveforms and data in highly configurable formats.
- Dynamically linked to Tanner T-Spice simulation and Tanner S-Edit schematic capture
- Waveform cross-probing directly in the schematic editor
- Easily handles large (10GB+) data files
- Available for Windows or Linux
- Create new traces based on mathematical expressions of other traces for advanced analysis and easy comparison with measured data max, min, average, intersect, rms, over/undershoot, amplitude, error, crossing, delay, period, frequency, rise/falltime, jitter, pulse width, settling time, integral, derivative, duty cycle, and slew rate