15/8/2023
Relevant product(s): AFS, EZWave, S-Edit
Operating systems: RHEL, Windows
Versions affected: 2022.2 release and above
Relevant area(s): Simulation
Summary
This article describes how to plot small-signal parameters of a component in your design. We will show how to configure the plotting settings both from the GUI as well as by netlisting to achieve this purpose.
Pre-requisites
- Testbench in S-Edit
- Configured PDK
- Access to models
Details
Know the device naming format (PDK specific)
In order to plot the small-signal parameters of your circuit components, you must first know your PDK’s device naming annotation. This will be different for every PDK depending on how the device is modelled.
The below steps will guide you through the steps:
- Run a simulation as usual, a DC Operating point analysis will do at this stage
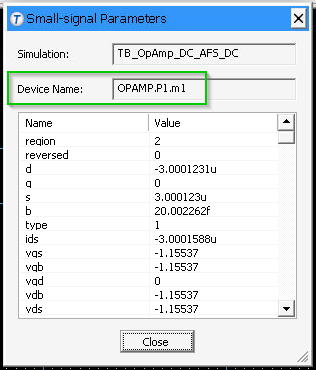
- Once the simulation has been completed, dive into the hierarchy in your circuit and double-click on the device, the “Small-signal Parameters” box should show. Below example showing the small signal parameters of a p-channel device
- Make note of the device’s name as indicated in the below figure
You can now plot the small signal parameters, using two methods: using the “Results” tab or using the “Additional Commands” tab.
Method 1 of 2: using the ‘Results’ tab
- Open the simulation setup box
- Navigate to the “Results” tab
- Add entries for the parameters you wish to plot using this format:
<Device name>:<Parameter name>
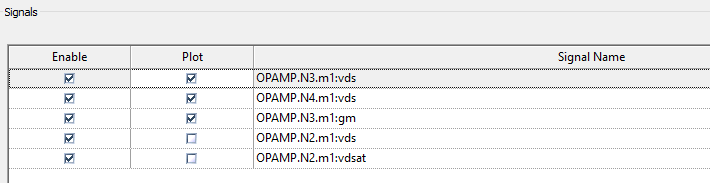
In our example, the device name has been “OPAMP.P1.m1”, so to plot the device’s “gm” parameter, the entry should be “OPAMP.P1.m1:gm”.
- Check the “Enable” and “Plot” fields as needed. The below example attempts plotting several parameters:
Method 2 of 2: using the ‘Additional Commands’ fields
- Open the simulation setup box
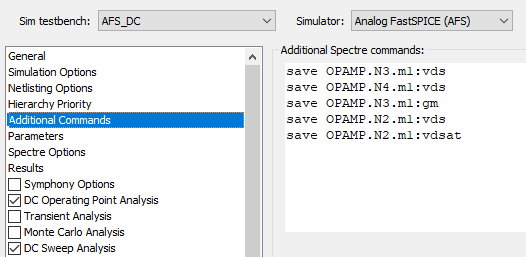
- Navigate to the “Additional Commands” tab
- Add the following line under the “Spectre” field to make AFS save the parameters:
save <Device name>:<parameter>Save the setting and run the simulation.
Example of this method:
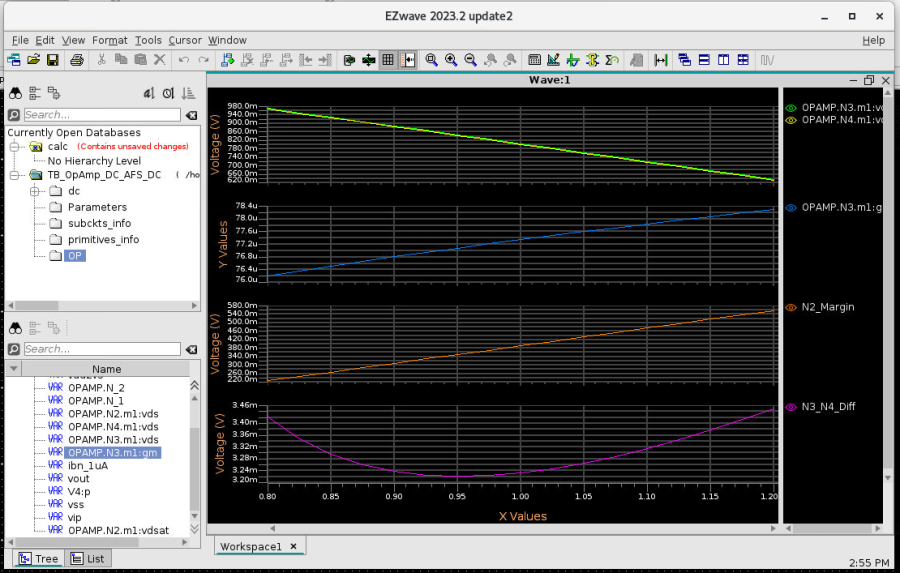
Displaying the results
In EZWave, the results are listed under “OP” section and should plot automatically if the “Plot” option was enabled for them. Below shows the “vgs” and “gm” of the device over a DC sweep simulation: