Published by Jessica Masters – Latest update: 04/04/2022
Relevant product(s): EZ-Wave
Operating systems: Linux RHEL 6 and above
Versions affected: All
Relevant area(s): Usage / Automation
Summary
EZ-Wave Waveform Calculator can be used to complete many calculations and extract waveforms. This guide explains how to take an existing compound wave and split it into separate waveforms, as well as combine separate waveforms to create a compound waveform.
Details
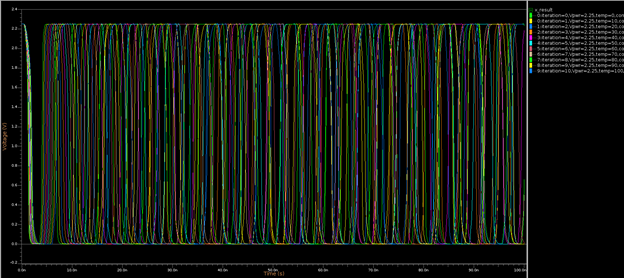
In the example attached, there is a compound waveform Out, which contains the output waveforms with varying voltage, corners, and temperature settings on the circuit. As this graph contains over 150 iterations, it can be beneficial to split this compound waveform into smaller compound waveforms to analyse the results.
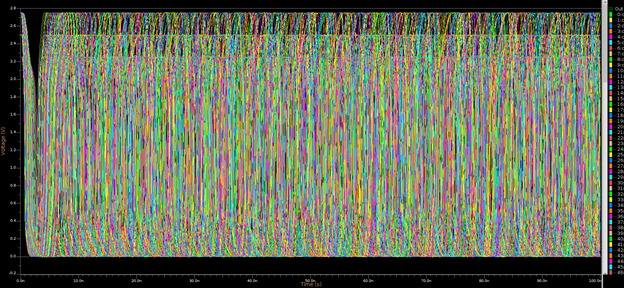
To open the original waveforms, open the folder TB_Ring_VCO_AFS_PVT.out in EZ-Wave. The calculation results are saved in the file Calc.wdb.
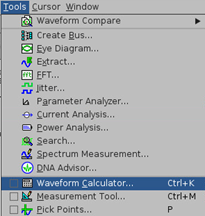
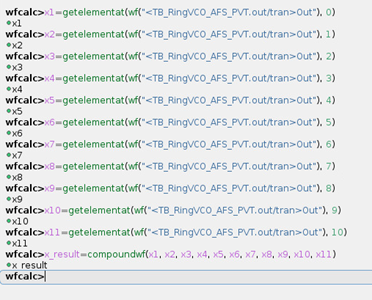
Split the iterations of the compound waveform Out to separate variables. To do this, you can use the getelementat() command. Open waveform calculator by opening Tools > Waveform Calculator, or using the default shortcut CTRL+K. This will open a new window called the Waveform Calculator.
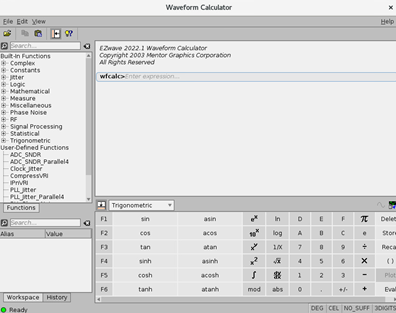
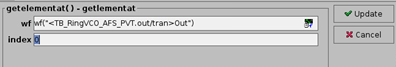
Type the following expression to extract the first iteration. As you start typing the command, there is an option that can be selected which uses a GUI display to enter the arguments and autofill the command:
x1=getelementat((wf(“<TB_RingVCO_AFS_PVT.out/tran>Out”), 0)

In the GUI option, drag and drop the Out waveform into the wf box. Set the index to the iteration number. Select the Update button to autofill the expression on the command line.
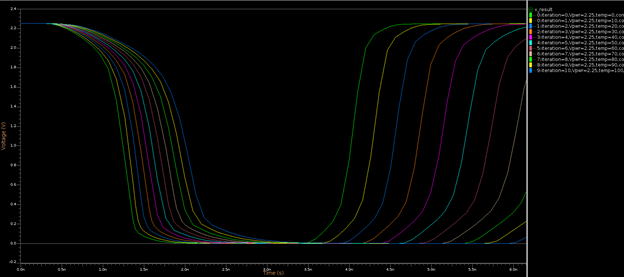
Press Enter to execute the command. This will plot the graph x1 on a new graph. This can be repeated for all iteration wanted. By splitting up the waveforms, it can make it easier to compare waves with different initial parameters. In this example, I have compared results with the same input voltages and corners but with varying temperatures.
To create a compound wave from selected waveforms, the following command can be used:
x_result=compoundwf(x1, x2, x3, x4, x5, x6, x7, x8, x9, x10, x11)
Where x1, x2, etc are the waveforms created from the getelementat() command.
x_result can then be viewed so waves can be easily compared with different temperature values.
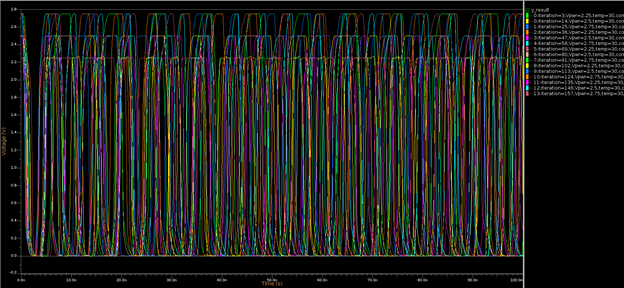
We also created another compound wave to compare the different voltages and corners with a constant temperature of 30 degrees. The compound wave (y_result) is saved in the database Calc.wdb, and can be seen below:
Useful references
The getelementas() command documentation: https://docs.sw.siemens.com/en-US/product/862138555/doc/DC202109053.docs.ezwave_ur.en_us/html/id54b9f35a-3e05-43c1-9d07-1a1fe9cec947
Attachments
EZ-Wave example here: https://we.tl/t-lJUIHKwSca