Published by Khalid Teama – Latest update on 14/10/2021
ID: TN021
Relevant product(s): S-Edit, Tanner Designer, EZWave
Operating systems: Linux or Windows
Versions affected: Tanner tools 2021.2 and above
Relevant area(s): Usage / Automation
Summary
This tech note uses an example to show how to feedback EZWave calculator results back into Tanner Designer and S-Edit.
Details
The EZWave calculator is capable of using user-defined functions written in Python, taking advantage of the ability to access returned data using Python dictionaries.
This tech note uses a function to perform spectrum measurement over a transient signal, and the end result would be the ability to access the values of the returned data using Python dictionaries in S-Edit, and therefore in Tanner Designer.
Requirements
- User-defined function for the EZWave calculator
- Circuit testbench
Steps
Please download the example provided in the attachments to follow the steps in this tech note.
EZWave setup
- Open the Python script “spec_meas.py” in a text editor to examine its contents. The script defines a function called “spectrum_meas”, which returns the result of a spectrum measurement operation in the form of dictionary. The function we are processing is called “vsig” and each parameter of the measurement is prepended with the parameter name and an ‘=’ sign. E.g. maximum frequency is “f_max”
- Place the script from step 1 above in a folder that can be seen by EZWave and invoke EZWave and the Waveform Calculator
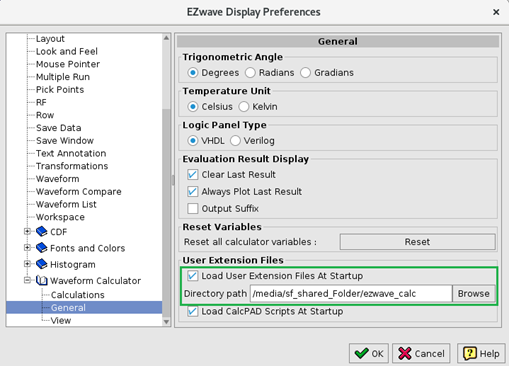
- Once the Waveform Calculator is opened, go to “Edit menu > Options > Waveform Calculator > General”, and enable option “Load User Extension Files At Startup”, pointing the “Directory path” to the folder where the script above was placed in Step 2
4. Close the Waveform Calculator and EZWave
S-Edit setup
- Open the design under “TD_EZWAVE” in S-Edit, and ensure the cell “tb_spectrum” is open, this is the testbench cell
- Go to Setup menu > Simulation, and navigate to the “Results” pane on the left. The below screenshot explains the setup
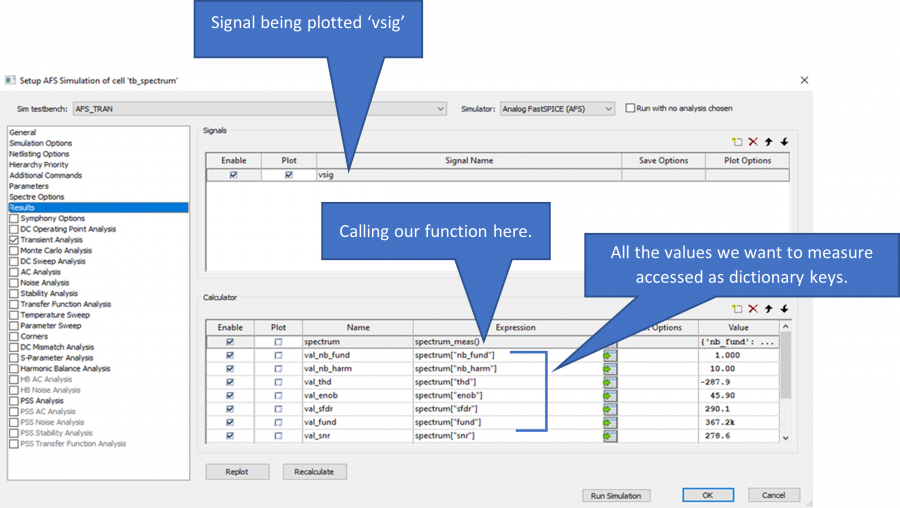
- Hit ‘Run Simulation’ to see how this works in EZWave and to generate some results
Tanner Designer setup
Please start Tanner Designer and follow these steps:
- Select the “New” button from the top panel to create a new aggregation folder setting and hit OK:
Choose aggregation folder to open = the “SimulationResults” in the provided example (TD_EZWAVE\tc\SimulationResults)
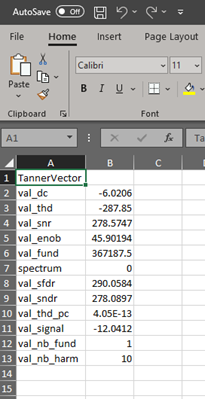
Output to Excel workbook file [Optional] = path to a new spreadsheet for this aggregation
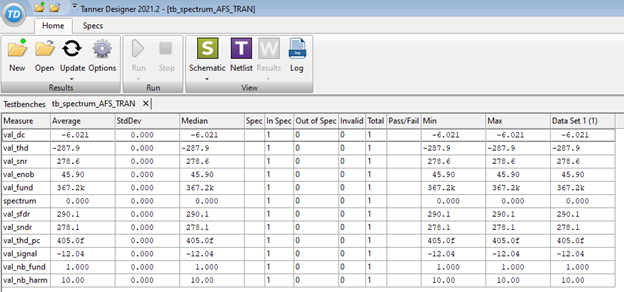
- Once the results have been read, you should be able to see their details in Tanner Designer and inside the Excel sheet created
Useful references
None
Attachments
Example attached here: https://we.tl/t-l8zFs5gNB0